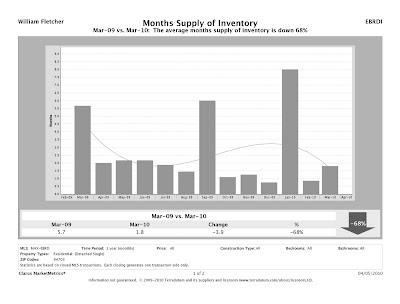
If you are planning on buying or selling a house in the Lorin District of South Berkeley (which is almost the same as zip code 94703) the charts below may prove useful:
The first chart shows a year's comparison of Median home prices. The second chart shows number of days on market and the third indicates the months supply of inventory. Typically as the numbers on charts 2 and 3 decrease the numbers on chart 1(sales price) should increase. This is basic suply and demand economics. From these charts you can easily see that the price trend is upwards. I expect that prices will level off a bit as interest rates increase, but consider the approximation to Ashby BART and the relative inexpensiveness of homes in this area and you may come to the same conclusion that I have, namely that prices will appreciate more rapidly in this area than in many others once the economy turns.
Click on to Enlarge
For more information, for home valuations or other real estate related needs, please visit my website: http://www.billfletcherhomes.com/ and call, email or text


No comments:
Post a Comment